
Login
Signup for Newsletter
Signup for Trade Ideas Trial Pack
MountFx
MFx Services
Automatic Trade
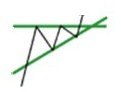
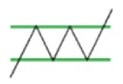
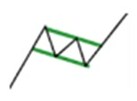
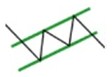
Ascending Triangle
TREND : BULLISH
RELIABILITY : MEDIUM
Characteristics:
- It usually a pause during a Bullish longer trend. To say pattern as an ascending triangle it must have flat highs & higher lows.
- It should have a horizontal resistance line at the top and an ascending trend line at the bottom. Ascending triangles are bullish because the buyers are able to maintain a high price, but sellers can't maintain a low price.
How to trade this pattern?:
Ascending triangles are bullish patterns wait until the top horizontal resistance line is broken with a strong candlestick. A strong candlestick means a candlestick which has a large body and small tails or no tails at all. Once the candlestick is completed Buyers re-enters the market and prices soon reach and break their old highs, So it is a good opportunity to go for long trade.
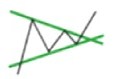
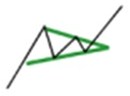
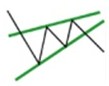
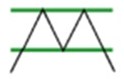
Symmetric Triangle
TREND : BULLISH
RELIABILITY : MEDIUM
Characteristics:
- It shows two converging trendlines (support levels & resistance levels) and is a bullish formation that usually forms during a currency pair in uptrend as a continuation pattern. (uptrend will continue)
- It confirmed when the currency pair price breaks out resistance levels of the symmetrical triangle.
How to trade this pattern?:
Symmetrical triangles are Bullish patterns wait until the candlestick breaks out resistance levels of the symmetrical triangle. Once the candlestick is completed Buyers re-enters the market and prices soon reach and break their old highs, So it is a good opportunity to go for long trade.
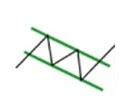
Channel Down
TREND : BULLISH
RELIABILITY : MEDIUM
Characteristics:
- It shows two parallel slope trendlines (support levels & resistance levels) and is a bullish formation that usually forms during a currency pair in downtrend as a reversal pattern.
- It confirmed when the currency pair price breaks out resistance levels of the parallel trendline.
How to trade this pattern?:
Channel down are Bullish patterns wait until the candlestick breaks out resistance levels of the parallel trendline. Once the candlestick is completed Buyers re-enters the market and prices soon reach and break their old highs, So it is a good opportunity to go for long trade.
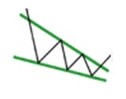
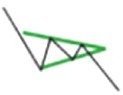
Falling Wedge
TREND : BULLISH
RELIABILITY : MEDIUM
Characteristics:
- The Falling Wedge Formation is also similar to a symmetrical triangle in appearance, in that they have converging trend lines that come together at an apex. However, wedges are distinguished by a noticeable slant.
- It is generally considered bullish and is usually found in uptrends. But they can also be found in downtrends as well. The implication however is still generally bullish. This pattern is marked by a series of lower tops and lower bottoms.
How to trade this pattern?:
Falling Wedge are Bullish patterns wait until the candlestick breaks out resistance levels of the trendline. Once the candlestick is completed Buyers re-enters the market and prices soon reach and break their old highs, So it is a good opportunity to go for long trade.
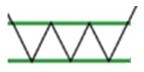
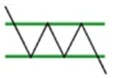
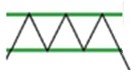
Rectangle
TREND : BULLISH
RELIABILITY : HIGH
Characteristics:
- A Rectangle or Box is a continuation pattern and describes a price pattern where supply and demand seems evenly balanced for an extended period of time. The currency pair moves in a tight range, finding support at the rectangle's bottom and hitting resistance at the rectangle's top.
- Buyers and sellers also seem equally matched. The same 'highs' are constantly tested as are the same 'lows'. The market vacillates between two clearly set parameters. If the prior trend was an uptrend, the most likely direction will be Bullish.
How to trade this pattern?:
Always try to trade Rectangle's in the direction of the previous (main) trend. It is Bullish patterns wait until the candlestick breaks out resistance levels of the trendline. Once the candlestick is completed Buyers re-enters the market and prices soon reach and break their old highs, So it is a good opportunity to go for long trade.
Inverse Head and Shoulders
TREND : BULLISH
RELIABILITY : HIGH
Characteristics:
- Inverse Head and Shoulders is a technical pattern that resembles the two shoulders and the head of a human being. This is a bullish pattern. This indicates a reversal after an downward trend.
- The Inverse head and shoulder pattern consists of three peaks of price movement. The middle peak is higher than the left and right peaks.The line drawn connecting the low points of the pattern is called neck line.
- No (or almost no) upper shadow
How to trade this pattern?:
When you see a head and shoulders format, wait until the neck line is broken with a strong candlestick. A strong candlestick means a candlestick which has a large body compared to the tails. If the neck line is broken by a strong candlestick body and moreover the candlestick does not have long tails so it is a very good opportunity to go for long trade. If the neck line is broken by the tail of a candlestick and not by the body of the candlestick then does not enter the trade.
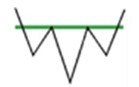
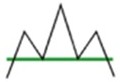
Triple Bottom
TREND : BULLISH
RELIABILITY : HIGH
Characteristics:
- Triple bottom formations are reversal patterns with bullish bias; It was identified by three consecutive lows of similar or almost height with 2 moderate pull backs in between neckline.
- It can be a major reversal pattern (if found on a daily chart or bigger timeframe) that can be formed after an extended downtrend. This pattern is confirmed when the currency pair price breaks from it's third bottom below through the neckline.
How to trade this pattern?:
Go long above the Neck Line (resistance level) when the currency pair price breaks from it's third bottom below, the most likely price direction is now up. Place your stop couples of pips below it's third bottom price. Your target must be at least twice the distance from it's third bottom break to the neckline.
Double Bottom
TREND : BULLISH
RELIABILITY : MEDIUM
Characteristics:
- A double bottom is a reversal pattern that is formed after there is an extended move down. The "bottoms" are floor which are formed after extended downtrends when two valleys have been formed.
- After hitting this level, the price will bounce off it slightly, but then return back to test the level again. If the price bounces off of that level again, then you have a DOUBLE bottom.
How to trade this pattern?:
With the double bottom, we would place our entry order above the neckline because we are anticipating a reversal of the downtrend.
Flag
TREND : BULLISH
RELIABILITY : HIGH
Characteristics:
- Flags can be categorized as continuation patterns. They usually represent only brief pauses in a dynamic stock. They are typically seen right after a big, quick move. The stock then usually takes off again in the same direction.
- It was characterized by lower tops and lower bottoms, with the pattern slanting against the trend. But unlike wedges, their trendlines run parallel.
How to trade this pattern?:
Always try to trade Flags in the direction of the previous (main) trend. It is Bullish patterns wait until the candlestick breaks out resistance levels of the trendline. Once the candlestick is completed Buyers re-enters the market and prices soon reach and break their old highs, So it is a good opportunity to go for long trade.
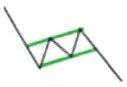
Pennant
TREND : BULLISH
RELIABILITY : MEDIUM
Characteristics:
- Pennants look very much like symmetrical triangles. But pennants are typically smaller in size (volatility) and duration.
- It confirmed when the currency pair price breaks out resistance levels of the triangle like symmetric.
How to trade this pattern?:
Always try to trade Pennant in the direction of the previous (main) trend. It is Bullish patterns wait until the candlestick breaks out resistance levels of the trendline. Once the candlestick is completed Buyers re-enters the market and prices soon reach and break their old highs, So it is a good opportunity to go for long trade.
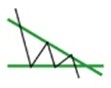
Descending Triangle
TREND : BEARISH
RELIABILITY : MEDIUM
Characteristics:
- It usually a pause during a Bearish longer trend. To say pattern as an descending triangle it must have flat lows & lower highs.
- It should have a horizontal support line at the bottom and an descending trend line at the top. Descending triangles are Bearish because the sellers are able to maintain a low price, but buyers can't maintain a high price.
How to trade this pattern?:
Descending triangles are bearish patterns wait until the bottom horizontal support line is broken with a strong candlestick. A strong candlestick means a candlestick which has a large body and small tails or no tails at all. Once the candlestick is completed Sellers re-enters the market and prices soon reach and break their old lows, So it is a good opportunity to go for short trade.
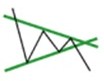
Symmetric Triangle
TREND : BEARISH
RELIABILITY : MEDIUM
Characteristics:
- It shows two converging trendlines (support levels & resistance levels) and is a Bearish formation that usually forms during a currency pair in downtrend as a continuation pattern. (downtrend will continue)
- It confirmed when the currency pair price breaks out support levels of the symmetrical triangle.
How to trade this pattern?:
Symmetrical triangles are Bearish patterns wait until the candlestick breaks out Support levels of the symmetrical triangle. Once the candlestick is completed Sellers re-enters the market and prices soon reach and break their old lows, So it is a good opportunity to go for short trade.
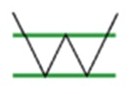
Channel Up
TREND : BEARISH
RELIABILITY : MEDIUM
Characteristics:
- It shows two parallel slope trendlines (support levels & resistance levels) and is a bearish formation that usually forms during a currency pair in uptrend as a reversal pattern.
- It confirmed when the currency pair price breaks out support levels of the parallel trendline.
How to trade this pattern?:
Channel up are bearish patterns wait until the candlestick breaks out support levels of the parallel trendline. Once the candlestick is completed Sellers re-enters the market and prices soon reach and break their old lows, So it is a good opportunity to go for short trade.
Rising Wedge
TREND : BEARISH
RELIABILITY : MEDIUM
Characteristics:
- IThe Rising Wedge Formation is also similar to a symmetrical triangle in appearance, in that they have converging trend lines that come together at an apex. However, wedges are distinguished by a noticeable slant.
- It is generally considered bearish and is usually found in downtrends. But they can also be found in uptrends as well. The implication however is still generally bearish. This pattern is marked by a series of higher tops and higher bottoms.
How to trade this pattern?:
Rising Wedge are Bearish patterns wait until the candlestick breakout support levels of the trendline. Once the candlestick is completed Sellers re-enters the market and prices soon reach and break their old lows, So it is a good opportunity to go for short trade.
Rectangle
TREND : BEARISH
RELIABILITY : HIGH
Characteristics:
- A Rectangle or Box is a continuation pattern and describes a price pattern where supply and demand seems evenly balanced for an extended period of time. The currency pair moves in a tight range, finding support at the rectangle's bottom and hitting resistance at the rectangle's top.
- Buyers and sellers also seem equally matched. The same 'highs' are constantly tested as are the same 'lows'. The market vacillates between two clearly set parameters. If the prior trend was an downtrend, the most likely direction will be Bearish.
How to trade this pattern?:
Always try to trade Rectangle's in the direction of the previous (main) trend. It is Bearish patterns wait until the candlestick breaks out support levels of the trendline. Once the candlestick is completed Sellers re-enters the market and prices soon reach and break their old lows, So it is a good opportunity to go for short trade.
Head And Shoulders
TREND : BEARISH
RELIABILITY : HIGH
Characteristics:
- Head and Shoulders is a technical pattern that resembles the two shoulders and the head of a human being. This is a bearish pattern. This indicates a reversal after an upward trend. This is a more common pattern in long term trends.
- The head and shoulder pattern consists of three peaks of price movement. The middle peak is higher than the left and right peaks. The line drawn connecting the low points of the pattern is called neck line.
How to trade this pattern?:
When you see a head and shoulders format, wait until the neck line is broken with a strong candlestick. A strong candlestick means a candlestick which has a large body compared to the tails. If the neck line is broken by a strong candlestick body and moreover the candlestick does not have long tails so it is a very good opportunity to go for short trade. If the neck line is broken by the tail of a candlestick and not by the body of the candlestick then does not enter the trade.
Triple Top
TREND : BEARISH
RELIABILITY : HIGH
Characteristics:
- Triple Top formations are reversal patterns with bearish bias; It was identified by three consecutive highs of similar or almost height with 2 moderate pull backs in between neckline.
- It can be a major reversal pattern (if found on a daily chart or bigger timeframe) that can be formed after an extended uptrend. This pattern is confirmed when the currency pair price breaks from its third peak above through the neckline.
How to trade this pattern?:
Go short below the Neck Line (support level) when the currency pair price breaks from its third peak above, the most likely price direction is now down. Place your stop couples of pips above its third peak price. Your target must be at least twice the distance from its third peak break to the neckline.
Double Top
TREND : BEARISH
RELIABILITY : MEDIUM
Characteristics:
- A double top is a reversal pattern that is formed after there is an extended move up. The "tops" are peaks which are formed when the price hits a certain level that can't be broken.
- After hitting this level, the price will bounce off it slightly, but then return back to test the level again. If the price bounces off of that level again, then you have a DOUBLE top.
How to trade this pattern?:
With the double top, we would place our entry order below the neckline because we are anticipating a reversal of the uptrend.
Flag
TREND : BEARISH
RELIABILITY : HIGH
Characteristics:
- Flags can be categorized as continuation patterns. They usually represent only brief pauses in a dynamic stock. They are typically seen right after a big, quick move. The stock then usually takes off again in the same direction.
- It was comprised of higher tops and higher bottoms, with the pattern slanting against the trend. But unlike wedges, their trendlines run parallel.
How to trade this pattern?:
Always try to trade Flags in the direction of the previous (main) trend. It is Bearish patterns wait until the candlestick breaks out support levels of the trendline. Once the candlestick is completed sellers re-enters the market and prices soon reach and break their old lows, So it is a good opportunity to go for short trade.
Pennant
TREND : BEARISH
RELIABILITY : MEDIUM
Characteristics:
- Pennants look very much like symmetrical triangles. But pennants are typically smaller in size (volatility) and duration.
- It confirmed when the currency pair price breaks out support levels of the triangle like symmetric.
How to trade this pattern?:
Always try to trade Pennant in the direction of the previous (main) trend. It is Bearish patterns wait until the candlestick breaks out support levels of the trendline. Once the candlestick is completed sellers re-enters the market and prices soon reach and break their old lows, So it is a good opportunity to go for short trade.